MeX turns any SEM into a optical 3D measuring system
MeX is a stand alone software package that turns any SEM with digital imaging into a true surface metrology device. Using stereoscopic images the software automatically retrieves 3D information and presents a highly accurate, robust and dense 3D dataset which is then used to perform traceable metrology examination.

What is possible with MeX

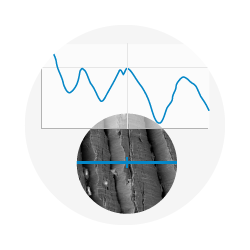
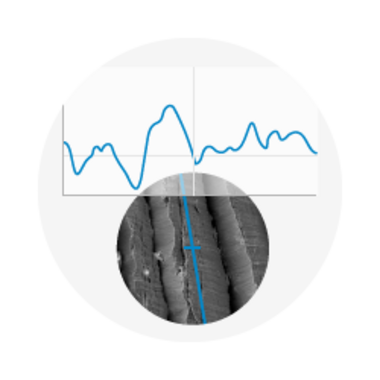
Height & roughness measurement
Profile measurement enables virtual cutting of specimen. The user defines a path on the optical image and receives the corresponding 3D profile. Roughness and contour measurements conform to recognized international EN ISO standards such as 4287/4288. The profile analysis also allows the fitting of primitives such as circles, angles or others.

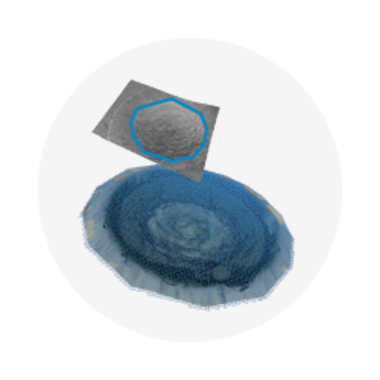
Volume analysis
Volume analysis calculates the volume of voids and protrusions. The measurement area is defined directly on the optical image. The volume is determined throughout the computation of a soap film model. For the 3Dboundary of the selected area MeX calculates a covering surface that behaves like a soap film.

Area measurements
Area analysis provides the determination of Sa, Sq and Sz over a surface. Parameters like roughness, waviness and the fractal dimension of user defined surface patches are achieved. MeX automatically calculates the ISO conform analysis. For the visual representation of the surface a grey scale or pseudo colored depth map can be used. It is also possible to display ISO-lines to highlight depth variations.


